Katy-Fulshear-Simonton Monthly Market Report, January 2026
After a skipped December report, we are back with a full look at how the new year opened across Katy, Fulshear, Simonton, and the surrounding corridor. January did not feel like a frenzy, but it did not feel slow either. The market moved along at a steady, businesslike pace, with enough inventory for buyers to compare options and enough absorption to keep well-priced listings moving.
For homeowners, this is a market that rewards realistic pricing and solid preparation rather than gambling on peak-of-the-boom numbers. For buyers, especially those watching mortgage rates, it is a good window to shop carefully and negotiate terms without having to make snap decisions.
At a Glance
- Territory: 77494, 77441, 77423, 77485/77476, 77406, 77450, 77407
- Total Active Listings (All): about 1,939 homes on the market, with roughly 1,333 resale and 606 new construction
- Sold Last 180 Days: about 2,837 closings across the corridor, split roughly 58 percent resale and 42 percent new construction
- Months of Supply (All): about 3.4 months overall, with resale near 4.1 months and new construction around 2.4 months
- 30 year and 15 year Fixed Snapshot: as of late January, Bankrate’s national survey put the average 30 year fixed near 6.2 percent and the 15 year fixed around 5.6 percent (Bankrate)
Market Conditions
When you translate the numbers into plain language, our local market is a mild seller market that is edging toward balanced. With about 1,939 active listings and 2,837 closed sales over the last 180 days, plus 603 homes currently under contract, the corridor is absorbing roughly 573 homes per month. That pace gives us about 3.4 months of supply overall.
In practice, that means buyers have choices, but not an unlimited menu. In the more popular price ranges and school zones, good listings still attract solid early showings and serious interest within the first few weeks. In the more distant or higher-priced segments, buyers take more time, and days on market stretch out unless sellers are ahead of the curve on pricing.
Compared with the national picture, we remain a bit tighter. For December 2025, the National Association of Realtors reported existing home sales running at a 4.35 million annual pace, with a national median price of about 405,400 dollars and 3.3 months of inventory. (National Association of REALTORS®) Many economists still describe that as a constrained but healing market. Our local months of supply are slightly lower, which fits what we see on the ground: a steady flow of buyers into the Katy Fulshear Simonton corridor and ongoing demand tied to the Energy Corridor and west Houston job base.
In showings, January felt like a month where buyers were serious but not panicked. They are watching rates, they know roughly what their monthly payment can be, and they are quick to pass on anything that feels overpriced or underprepared. At the same time, when a listing checks the right boxes on location, layout, and condition, offers still come together without a lot of drama, especially in the first 30 to 45 days.
New vs Used
The balance between new construction and resale is one of the clearest stories right now.
On the new side, builders are carrying about 606 active homes in this dataset, with another 311 already under contract. Over the last 180 days, 1,186 new homes have closed. That works out to a monthly absorption of roughly 249 sales plus pendings and a months of supply figure around 2.4. That is solidly in seller market territory, even if it does not feel like the peak years.
Resale inventory is larger, with about 1,333 active listings and 292 under contract. Over the same 180 day window, 1,651 resale homes have closed, giving a monthly absorption around 324 and a months of supply just over 4.1. That is much closer to a balanced band. Many analysts consider 4.5 to 6 months of supply to be a classic balanced market, so resale is hovering just under that level while new construction is clearly tighter. (National Association of Home Builders)
Median values tell a similar story. Across all sales, the median sold price sits around 425,000 dollars, with a median sold price per square foot near 170 and a median cumulative days on market of 61. Resale medians run about 427,000 dollars and 167 dollars per square foot with a 58 day median. New construction medians sit near 424,000 dollars and 173 dollars per square foot with a 64 day median. In other words, buyers are paying a small premium per square foot for brand new homes and slightly more for resale on pure price, which reflects larger resale square footages and lot sizes in some of the established neighborhoods.
For sellers, the takeaway is straightforward. Resale listings need to compete on value, condition, and presentation, not just on square footage. If you are surrounded by new sections or active builders, your price should make sense in relation to those model homes and incentives. For buyers, it is smart to keep an open mind. If you love the idea of new construction, walk a few resales in the same price band. If you prefer a mature neighborhood, at least glance at what the builders are offering nearby to help frame your expectations.
City and Zip Spotlights
City by city, the corridor continues to show different personalities.
In Katy, the market remains fast-paced but orderly. About 874 sales closed over the last 180 days with a median sold price around 450,000 dollars, a median price per square foot near 169, and a median cumulative days on market of about 51. The core Katy zips, especially 77494 and 77450, see strong demand for established neighborhoods with Katy ISD schools and mature amenities. In 77494 alone, roughly 600 homes closed, with a median price around 515,000 dollars, a median price per square foot in the mid 170s, and a median DOM in the mid 50s. Buyers here still move quickly when a home is well presented and priced inside the recent sold range rather than above it.
Fulshear continues to be a construction engine. Over the last 180 days, about 853 sales closed with a median price near 442,000 dollars, a median price per square foot around 171, and a median DOM close to 59. In 77441, which carries much of the Fulshear activity, there were about 697 sales with a median price just under 446,000 dollars. Big master planned communities such as Cross Creek Ranch, Cross Creek West, Weston Lakes, Jordan Ranch, Candela, and Tamarron drive a large share of this volume. New sections and builder incentives matter here, and buyers frequently tour multiple communities before committing. That added comparison time shows up in slightly longer days on market compared with the hottest parts of Katy.
Richmond carries the highest raw number of closings in this dataset at about 927 over 180 days. The median price sits around 415,000 dollars, with a median price per square foot near 172 and a median DOM around 65. Zips 77406 and 77407 together represent a wide range of product, from older sections of Pecan Grove and Long Meadow Farms to newer phases in Lakes of Bella Terra, Harvest Green, and Aliana. In 77406, the median price is roughly 430,000 dollars with a median price per square foot near 173 and a median DOM in the low 60s. In 77407, the median price is closer to 400,000 dollars with a median DOM around 71. Updated homes in the stronger school zones of these areas still move well; original finish homes tend to linger until pricing catches up with buyer expectations.
To the west, Brookshire and the 77423 zip offer a more budget-conscious profile. Roughly 160 sales closed in Brookshire, with a median price near 310,000 dollars and a median DOM around 90. In 77423 as a whole, there were about 306 closings with a median price around 345,000 dollars and a median price per square foot in the high 160s. Buyers here often trade a longer drive for more space or a newer home at a lower price point. The longer DOM figures tell you there is more room for negotiation, especially on homes that have been on the market more than two to three months.
Simonton and Wallis, grouped together for this report, still make up a small but distinct niche. Combined, they saw 17 closings over the last 180 days. The median price sits around 250,000 dollars, with a median price per square foot near 140 and a median DOM in the high 50s. Looking strictly at the 77485 and 77476 zip codes together, there were about 18 closings with a median price close to 285,000 dollars and a median DOM just under 60 days. Acreage, older homes, and a more rural setting attract a specific buyer who is often less rate sensitive and more focused on land and freedom. Pricing those properties as if they are inside the big master planned communities tends to backfire; pricing them correctly brings committed buyers even if the pool is smaller.
Finally, higher end pockets like Weston Lakes, the upscale sections of Cross Creek Ranch, and custom homes along the Brazos are still closing, but with a narrower buyer base. In the 750,000 to 1,000,000 dollar band, the corridor saw about 170 closings with a median price around 828,000 dollars, a median price per square foot close to 197, and a median DOM in the low 60s. Above 1,000,000 dollars, roughly 67 homes closed with a median price just under 1.33 million and a median price per square foot in the mid 250s. Those listings may not pull the same number of showings as mid range homes, but the buyers who do show up are serious.
Pricing and Value Signals
Zooming out to the entire territory, the center of gravity sits between the low 300s and the high 500s.
In the under 350,000 dollar band, about 860 homes closed over the last 180 days. The median price for that group is near 310,000 dollars, with a median price per square foot around 160 and a median DOM just under 50 days. This is where many first time buyers and investors are active, and it remains competitive when homes are clean and ready.
Between 350,000 and 500,000 dollars, there were roughly 985 closings, making this the largest single slice of the market. The median price sits near 415,000 dollars, with a median price per square foot around 165 and a median DOM in the mid 60s. That extra time reflects buyers weighing commute, schools, and community amenities carefully. It is also the band where many families compare new construction against updated resale.
In the 500,000 to 750,000 dollar range, about 755 homes closed with a median price around 590,000 dollars, a median price per square foot in the upper 170s, and a median DOM in the low 70s. This is the classic move up segment, and buyers here tend to be more selective about finish quality, floor plan, and lot position. Listings that are dialed in on condition can still move quickly; listings that rely on size alone without updates usually take price reductions before selling.
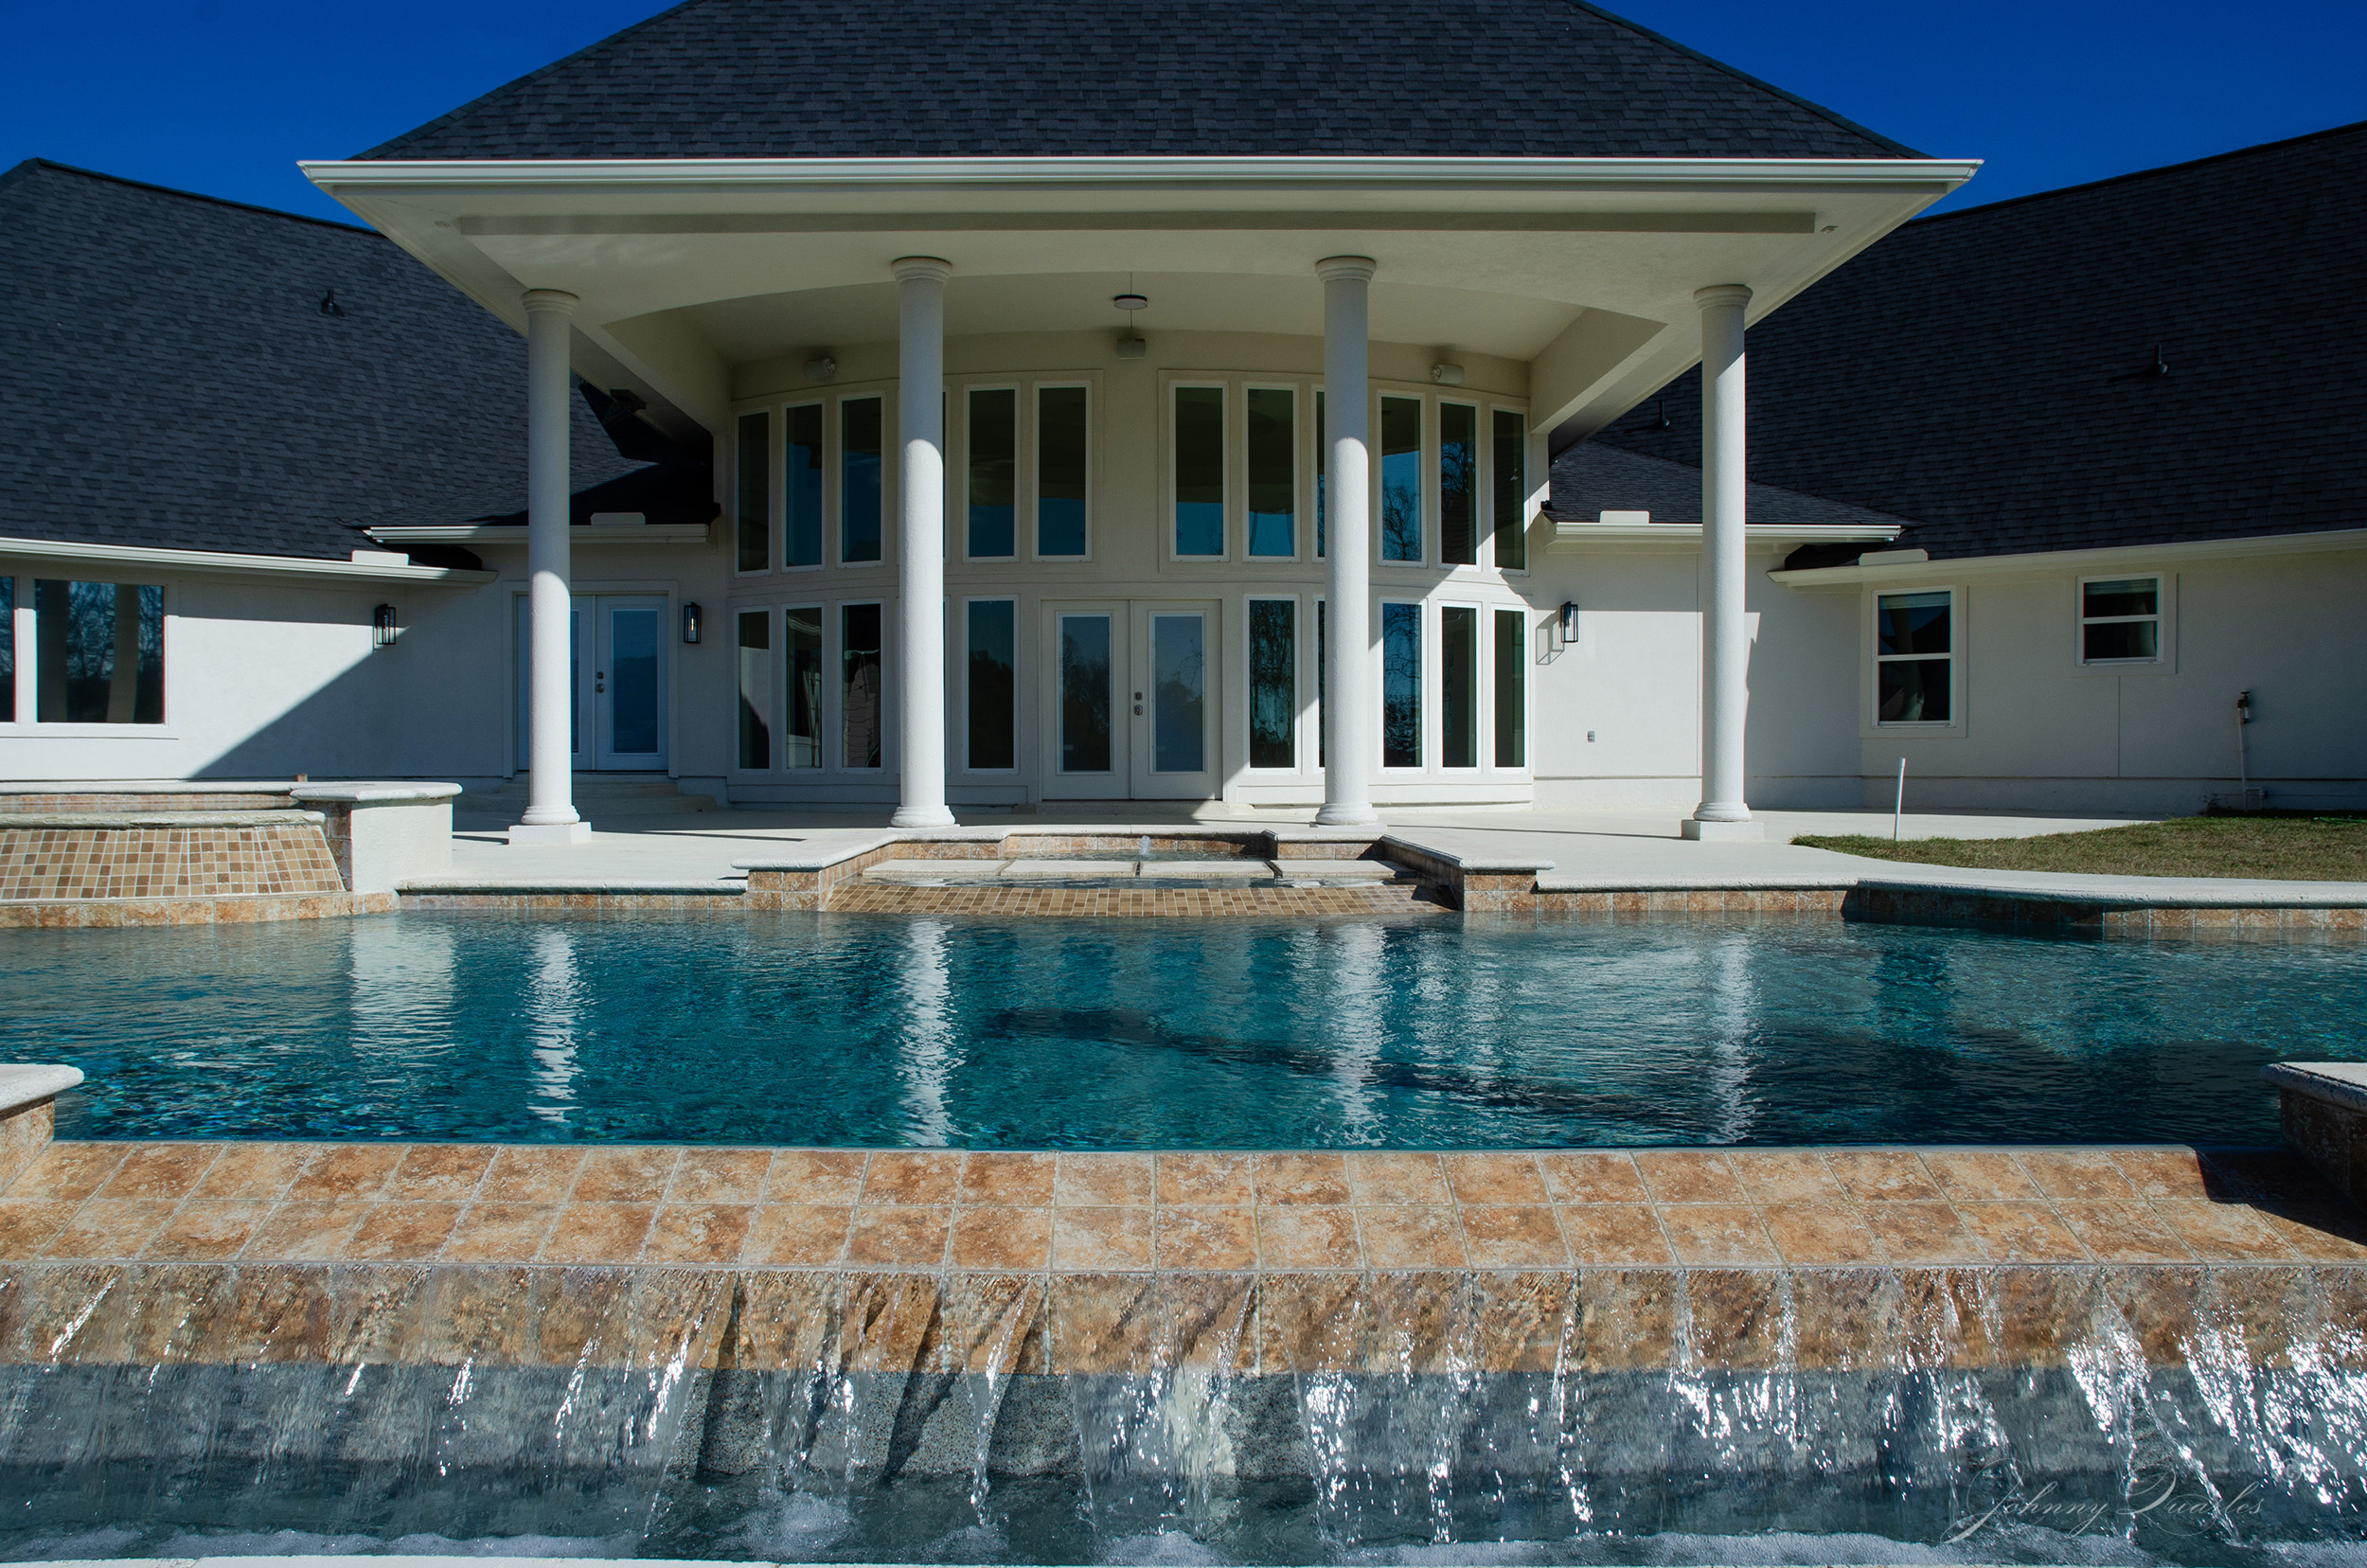
At the high end, homes with a private pool stand out. Pool homes in this dataset have a median price around 653,000 dollars and a median price per square foot near 187, compared with a 400,000 dollar median and roughly 168 dollars per square foot for homes without a pool. Days on market for pool homes are slightly lower than the overall median, which tells you that, when priced correctly, a well maintained pool is still a strong selling point rather than a liability.
Days on Market and Price Movement
Across all sold homes, the median cumulative days on market is about 61 days, but the spread behind that median matters. Roughly 31 percent of sales closed after 30 days or less on the market, another 18 percent closed in the 31 to 60 day window, about 15 percent fell between 61 and 90 days, and nearly 35 percent took longer than 90 days. That last group often includes homes that started too high and drifted downward, or that needed significant updating to attract the right buyer.
The price change data reinforces the importance of getting close to the number early. Among current resales, about 262 of the 1,333 active homes have already had at least one price reduction, which is roughly 20 percent. On the new construction side, about 267 of 606 active homes show a reduction, which is roughly 44 percent. For homes already under contract, around 11 percent of resale pendings and about 23 percent of new home pendings have a recorded price cut.
Taken together, that says buyers are responding fastest to listings that launch near the true market value, and they are punishing those that aim well above where the recent closed data supports. When a listing drifts into the 60 to 90 day range without a clear adjustment, it tends to land in that 90 plus day bucket with more pressure to negotiate on inspection items and closing costs.
For most sellers in this market, a single meaningful adjustment in the three to four week range works better than a series of tiny reductions. A change that moves you into a more attractive search bracket or under a key psychological threshold can pull in a fresh wave of buyers who filtered you out at the original list price.
Optional Notes on Schools and Amenities
School districts are still a major driver of value. Properties in Katy ISD within our territory show a median price around 465,000 dollars, a median price per square foot near 171, and a median DOM in the upper 40s. In Lamar Consolidated ISD, which covers a large portion of Fulshear and Richmond, the median price is closer to 408,000 dollars with a median DOM in the mid 60s. Fort Bend ISD pockets in this dataset land with a median price around 440,000 dollars, a median price per square foot in the high 170s, and a median DOM near the high 60s.
Amenities inside the master planned communities continue to matter as well. Homes on lakes, greenbelt corridors, or within comfortable walking distance of pools, playgrounds, and community centers in places like Cross Creek Ranch, Harvest Green, and Tamarron consistently sell faster and closer to list price than interior lots on busier streets. Buyers who moved during or after the pandemic have not forgotten how important neighborhood amenities and outdoor space can be to daily life.
What This Means if You are Selling
If you are thinking about selling in 2026, this is a good time to treat your home like a product launch, not an experiment.
Start with the data that actually matters. Look at the last three to six months of closed sales within your immediate area and school zone, paying close attention to price per square foot, days on market, and any obvious differences in condition. Your list price should make sense inside that range, not above it. With overall supply around 3.4 months and resale supply just over 4 months, buyers can afford to walk away from a listing that feels out of step.
Next, focus on preparation and presentation. The homes that still sell inside the first 30 to 45 days share a few traits: clean lines, neutral paint, good lighting, trimmed landscaping, and professional photography. In the current market, many buyers are opening a dozen browser tabs at once; you want your photos and description to land in their short list before they even decide which homes to tour.
Finally, have an adjustment plan before you go live. Given what we see in the data, it makes sense to review activity and feedback at the three to four week mark. If showings are strong but no serious offers have materialized, consider one meaningful adjustment that brings you clearly into line with recent closings. That approach usually produces a better net result than waiting 90 days and then making a large cut under pressure.
What This Means if You are Buying
For buyers, January’s numbers add up to a rare combination: there is enough inventory to compare, but not so much that quality homes sit untouched.
If you are shopping under about 500,000 dollars, be prepared to act decisively on homes that fit your needs. Roughly a third of all sales are still happening inside 30 days, and another chunk close by 60 days. Have your pre approval ready, know your comfortable monthly payment, and keep an eye on how different price points feel once you factor in taxes and insurance. With 30 year fixed rates hovering in the low 6 percent range and 15 year loans in the mid 5 percent range, structuring the financing matters as much as squeezing the last few thousand off the price. (Bankrate)
Talk with your lender and agent about using seller credits creatively. In many cases, asking for a closing cost credit or a temporary rate buydown gives you more real world benefit than a small price reduction. Sellers in the 60 plus days on market group are often more open to these structures, especially in the higher price bands or in areas with more competition from nearby new construction.
For out of state buyers considering Houston and the Energy Corridor, the Katy Fulshear Simonton corridor continues to offer a mix of strong schools, master planned communities, small town options, and acreage. Spending time up front understanding how 77494, 77441, 77406, 77407, 77423, and 77485/77476 differ on price, days on market, and lifestyle will help you avoid “zip code shock” when you start touring homes in person.
Methodology and Notes
This report looks at current Active and Pending listings, along with homes that closed within roughly the last 180 days in our Katy Fulshear Simonton corridor and nearby zips. Pending includes homes marked Pending, Option Pending, or Pending Continue to Show. New construction versus resale is determined by the New Construction field. All sold price and price per square foot figures come only from closed sales. Monthly absorption is calculated as the total of Sold homes plus current Pendings divided by six months, and Months of Supply is Active inventory divided by that absorption rate.

Leave a Reply
Your email is safe with us.
You must be logged in to post a comment.